Agriculture & Land

Eyes on every field,
every season.

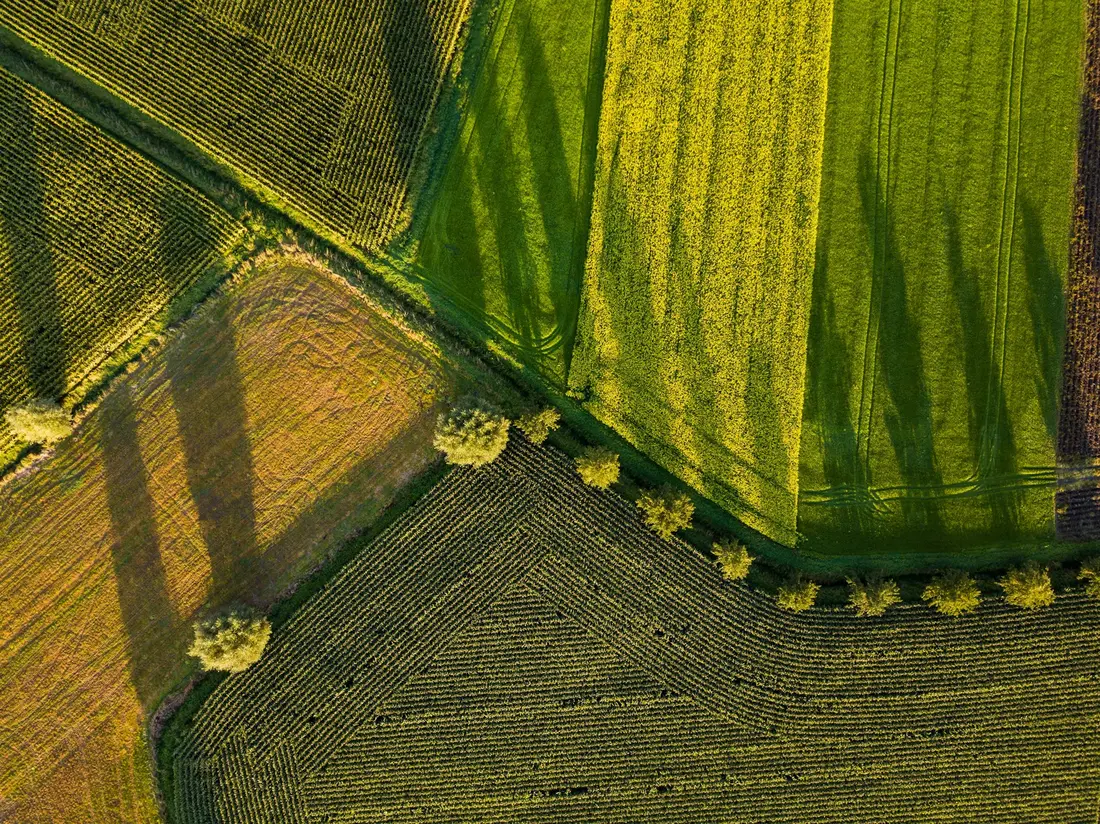
Crop vigor, irrigation stress and seasonal dynamics monitored continuously with AI, satellite imagery, drones and field data.

Sample indicators · illustrative values
128.6 ha
Field monitored
0.72
Avg. NDVI
Low
Water stress
What we monitor

What we monitor

  • Crop vigor Track crop health and performance over time.
  • Land use Classify and monitor agricultural land use.
  • Irrigation stress Detect water stress and optimize irrigation.
  • Field boundaries Map and monitor fields with high accuracy.
  • Vegetation anomalies Identify anomalies, pests and disturbance.
  • Seasonal dynamics Analyze vegetation changes across seasons.
Indicators

Sample indicators

01

NDVI / Crop health

Measure crop vigor and health.
02

Vegetation cover

Quantify green cover over time.

03

Biomass proxy

Estimate biomass and productivity.

04

Water stress

Detect moisture stress and risk.

05

Land use distribution

Monitor land-use composition.

06

Change detection

Track changes in land & vegetation.

07

Field-level alerts

Receive timely alerts on key events.

08

Seasonal trend

Compare year-over-year dynamics.

What we deliver

From imagery to action

01

Thematic maps

Actionable maps at field, farm or regional scale.

02

Key indicators

Standardized indicators to track performance.

03

Interactive dashboards

Visualize trends and monitor in near real time.

04

Decision support

Insights and alerts to support better decisions.

Applications

Where CASSIA Agri makes a difference

Crop monitoring · track crop health and stages Precision agriculture · optimize inputs and field operations Irrigation planning · manage water use efficiently Land management · monitor land use and degradation Agricultural reporting · comply and report with confidence
Why CASSIA

A traditional survey takes weeks.
A satellite pass takes a morning.

01

Continuous monitoring

No field teams required. Satellites pass overhead every few days.

02

Full spatial coverage

Wall-to-wall, repeatable, standardized not a sample of plots.

03

Drastic cost reduction

A fraction of what traditional surveys cost and far more often.

04

AI-powered indicators

Decision-ready metrics not raw rasters you have to interpret.

05

Weeks → hours

From data acquisition to actionable map, in a single working day.

Start here

Your fields,
observed continuously.

Send us a shapefile of your fields. We will return a sample NDVI series and a 20-min walk-through within a week.

Contact us →