Linear Infrastructure

Ecological management
of transport networks.

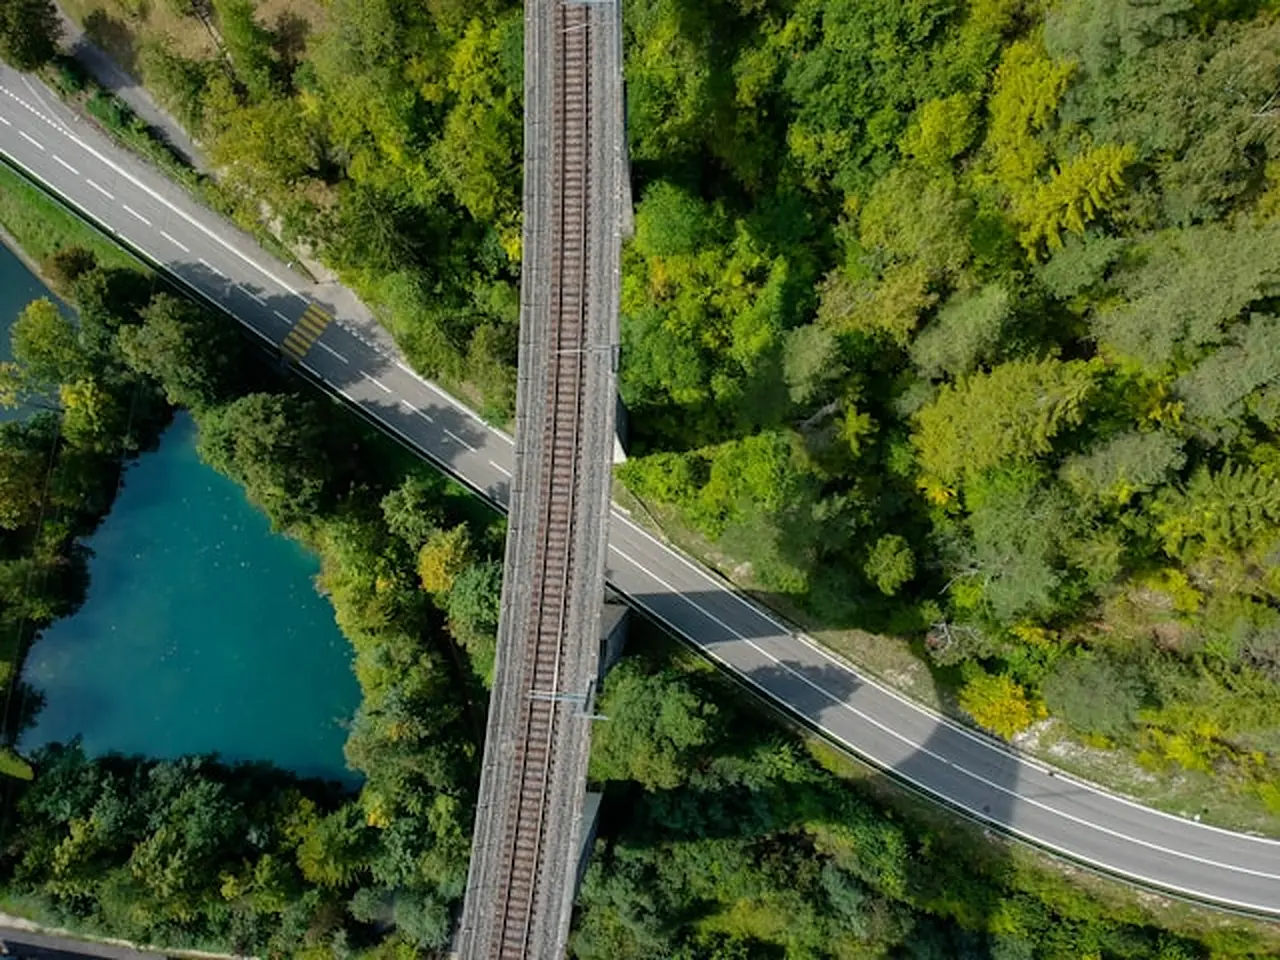
Thousands of kilometers of transport infrastructure cross sensitive ecosystems. Traditional inspection is costly, manual, and too infrequent to prevent impacts or prioritize actions effectively.

Sample indicators · illustrative values
3.4 m
Avg. vegetation height
78%
Corridor continuity
12.7 ha
Invasive species detected
What we monitor

What we monitor

  • Vegetation height along rights-of-way Continuous LiDAR-grade height tracking.
  • Invasive species detection Spread along corridors and verges.
  • Biodiversity corridor continuity Where the corridor breaks or recovers.
  • Maintenance priority Where action matters most this season.
  • Slope vegetation stability Cover health on engineered slopes.
  • Ecological permeability Crossing opportunities for fauna.
  • Canopy encroachment Kilometres of overhang per section.
  • Annual change detection What grew, fell, or vanished year-over-year.
Indicators

Key indicators

01

Vegetation height

Per-section average and max.
02

Corridor continuity

% of intact corridor.

03

Canopy encroachment

Affected linear kilometres.

04

Invasive species detected

Hectares per epoch.

05

Slope stability score

% stable slope cover.

06

Ecological permeability

Composite crossing index.

07

Annual change

% vegetation loss / gain.

08

Maintenance priority

Section-level urgency.

What we deliver

What we deliver

01

Maps

High-resolution, multi-layer ecological maps.

02

Indicators

Clear, actionable KPIs on ecosystem conditions.

03

Alerts

Early warnings for risks and encroachments.

04

Prioritization tools

Data-driven recommendations to focus resources where they matter most.

Applications

Application domains

Roads Railways Canals Public authorities Biodiversity Ecological connectivity
Why CASSIA

A traditional survey takes weeks.
A satellite pass takes a morning.

01

Continuous monitoring

No field teams required. Satellites pass overhead every few days.

02

Full spatial coverage

Wall-to-wall, repeatable, standardized not a sample of plots.

03

Drastic cost reduction

A fraction of what traditional surveys cost and far more often.

04

AI-powered indicators

Decision-ready metrics not raw rasters you have to interpret.

05

Weeks → hours

From data acquisition to actionable map, in a single working day.

Start here

Your network,
in continuous focus.

Send us a network segment. We will return a vegetation height map, an encroachment alert layer and a corridor continuity score within a week.

Contact us →