Soils & Carbon

From soil intelligence
to carbon monitoring.

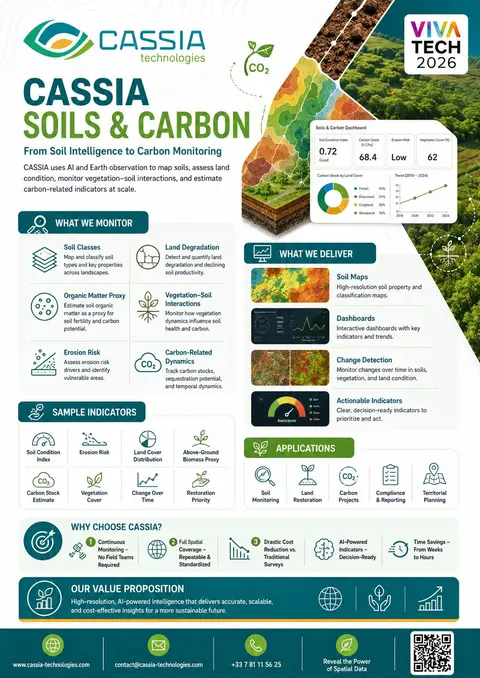
AI and Earth observation to map soils, assess land condition, monitor vegetation–soil interactions, and estimate carbon-related indicators at scale.

Sample indicators · illustrative values
0.72
Soil condition index
68.4
Above-ground biomass
Low
Erosion risk
What we monitor

What we monitor

  • Soil classes Map and classify soil types and key properties across landscapes.
  • Land degradation Detect and quantify degradation and soil productivity loss.
  • Organic matter proxy Estimate soil organic matter as a proxy for fertility and carbon.
  • Vegetation–soil interactions How vegetation dynamics influence soil health.
  • Erosion risk Assess drivers and identify vulnerable areas.
  • Carbon-related dynamics Track stocks, sequestration potential and trends.
Indicators

Sample indicators

01

Soil condition index

Composite health metric.
02

Erosion risk

Risk score per pixel.

03

Land-cover distribution

Composition by class.

04

Above-ground biomass proxy

Stand-level estimate.

05

Carbon stock estimate

Per hectare, per epoch.

06

Vegetation cover

Green cover dynamics.

07

Change over time

Trajectory across years.

08

Restoration priority

Where intervention matters.

What we deliver

What we deliver

01

Soil maps

High-resolution soil property and classification maps.

02

Dashboards

Interactive dashboards with key indicators and trends.

03

Change detection

Monitor changes in soils, vegetation and land condition.

04

Actionable indicators

Clear, decision-ready metrics to prioritize and act.

Applications

Applications

Soil monitoring Land restoration Carbon projects · MRV-ready outputs Compliance & reporting Territorial planning
Why CASSIA

A traditional survey takes weeks.
A satellite pass takes a morning.

01

Continuous monitoring

No field teams required. Satellites pass overhead every few days.

02

Full spatial coverage

Wall-to-wall, repeatable, standardized not a sample of plots.

03

Drastic cost reduction

A fraction of what traditional surveys cost and far more often.

04

AI-powered indicators

Decision-ready metrics not raw rasters you have to interpret.

05

Weeks → hours

From data acquisition to actionable map, in a single working day.

Start here

Map a soil,
measure its carbon.

Send us a study area. We will return a soil classification, an erosion risk map and a carbon stock estimate within a week.

Contact us →