Biodiversity & Habitats

From satellite
to species.

Habitat classification, ecological connectivity, conservation status continuous, science-based monitoring at landscape scale.

500,000 km²
Mapped to date
Since 2018
Operational
EUNIS · CLC
Standards compatible
What we monitor

What we monitor

  • Habitat classification Continuous mapping of natural habitats at landscape scale.
  • Vegetation dynamics Seasonal and inter-annual change in vegetation cover.
  • Ecological connectivity Detect corridors and barriers across the territory.
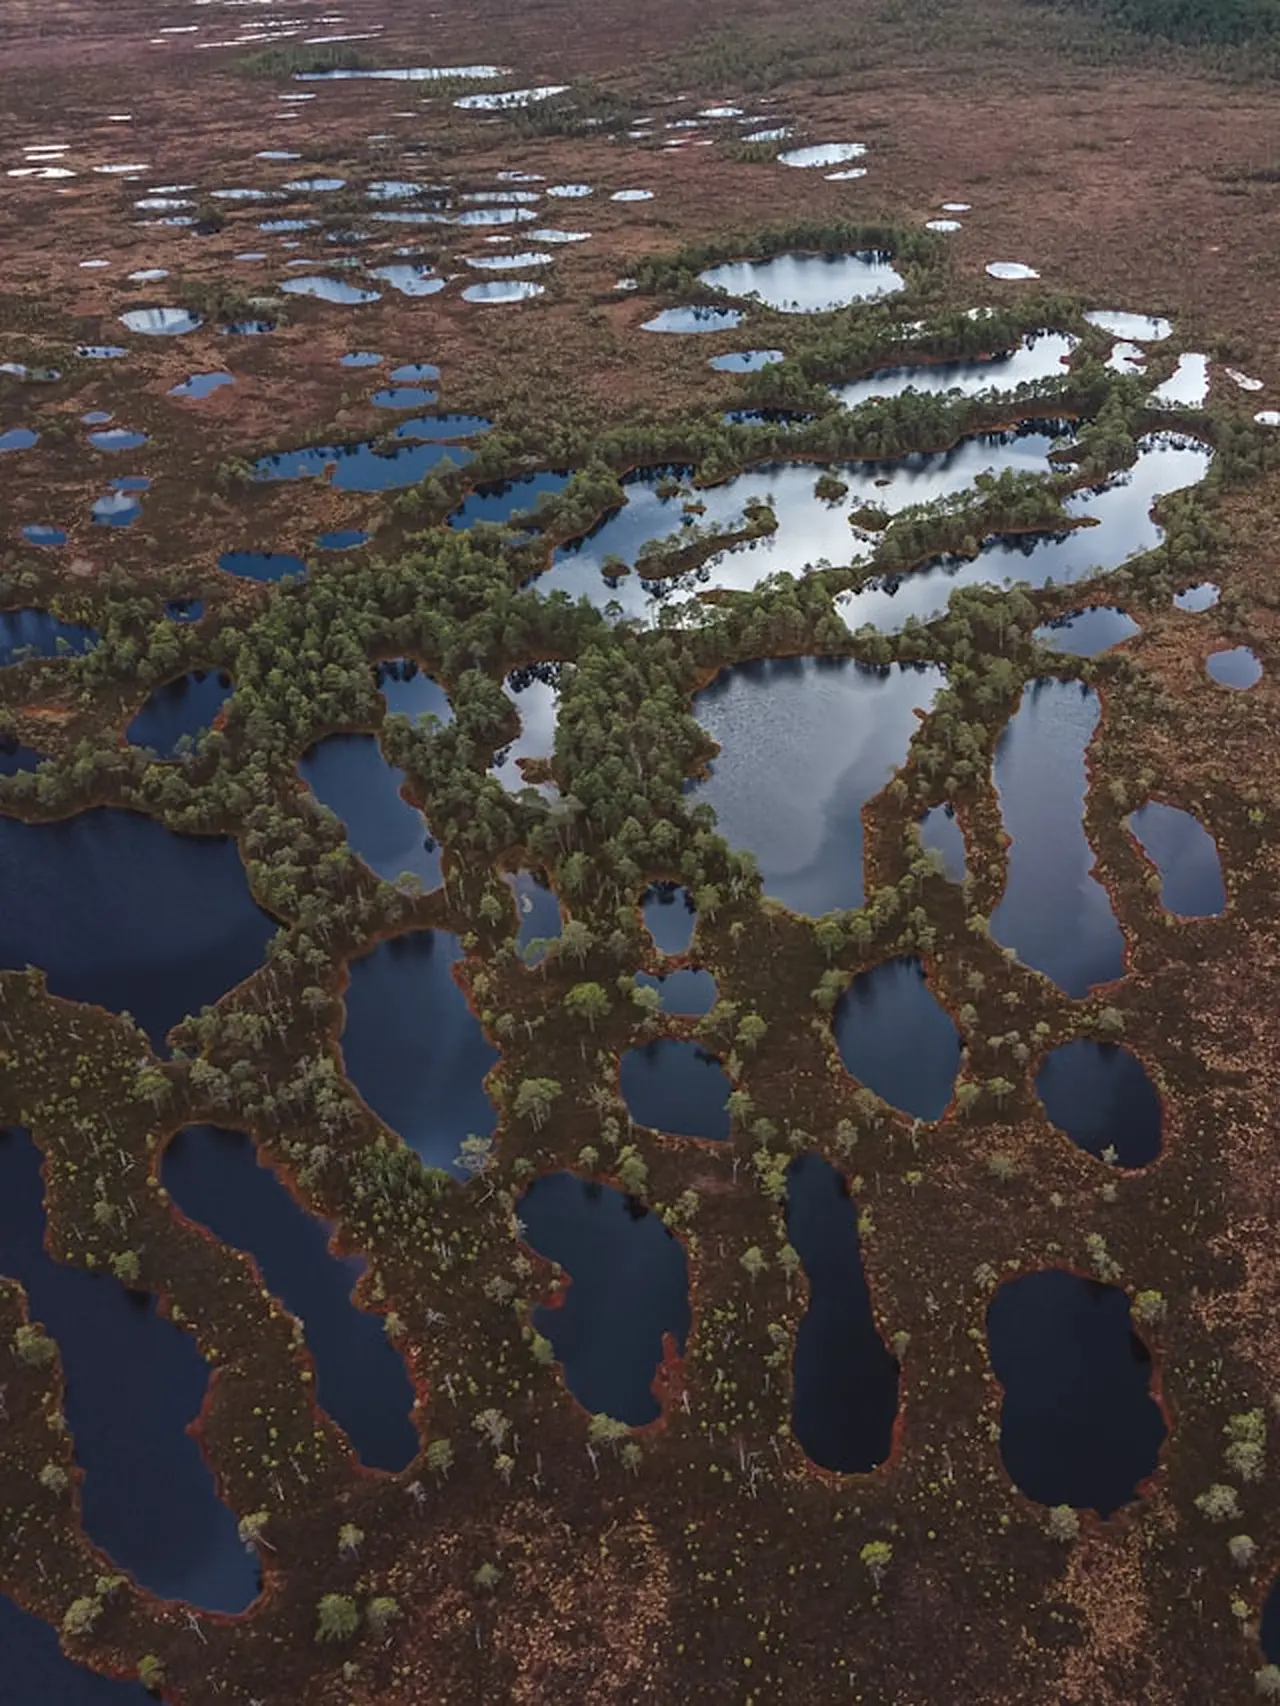
  • Wetland monitoring Surface change, water permanence, vegetation transitions.
  • Invasive species Pressure indices for known invasive populations.
  • Habitat fragmentation Patch size, edge density, isolation indices.
  • Phenological cycles Timing of growth and senescence across years.
  • Conservation status Track health and trajectory of protected sites.
Indicators

Key indicators

01

Habitat classification map

Standardized, comparable layers.
02

Vegetation diversity index

Compositional richness over time.

03

Fragmentation rate

Patch metrics across the landscape.

04

Ecological connectivity

Corridor integrity score.

05

Phenological metrics

Start, peak and end of season.

06

Wetland surface change

Area gained or lost per epoch.

07

Invasive pressure index

Hotspot identification and trend.

08

Conservation status score

Composite health of protected areas.

What we deliver

What we deliver

01

Habitat maps

High-resolution, standardized maps EUNIS and CLC compatible.

02

Indicators

Science-based metrics to measure and track ecosystem health.

03

Long-term monitoring

Time series from satellite data to detect trends and change.

04

Dashboards

Interactive web dashboards for exploration and decision support.

05

Reporting support

Custom reports aligned with EU, national and international requirements.

Applications

Where it lands

Nature reserves · monitor & manage biodiversity in protected areas Environmental agencies · national & regional reporting Ecological studies · impact assessments & planning Protected areas · conservation strategies & effectiveness
Why CASSIA

A traditional survey takes weeks.
A satellite pass takes a morning.

01

Continuous monitoring

No field teams required. Satellites pass overhead every few days.

02

Full spatial coverage

Wall-to-wall, repeatable, standardized not a sample of plots.

03

Drastic cost reduction

A fraction of what traditional surveys cost and far more often.

04

AI-powered indicators

Decision-ready metrics not raw rasters you have to interpret.

05

Weeks → hours

From data acquisition to actionable map, in a single working day.

Start here

Map a habitat,
measure a trend.

Send us the perimeter of a protected area or study site. We will return a habitat classification and a connectivity report within a week.

Contact us →