LiDAR · 3D Analysis

LiDAR & 3D
ecosystem intelligence.

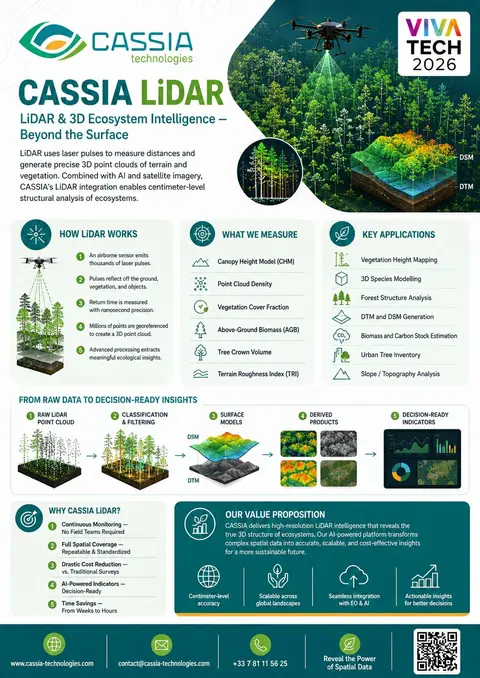
Laser pulses measure distances and generate precise 3D point clouds of terrain and vegetation. Combined with AI and satellite imagery, CASSIA LiDAR enables centimetre-level structural analysis of ecosystems.

~cm
Accuracy
CHM · DTM · DSM
Standard outputs
AGB
Biomass estimation
What we monitor

What we measure

  • Canopy height model (CHM) Vegetation height per pixel.
  • Point cloud density Acquisition quality metrics.
  • Vegetation cover fraction Closed vs. open canopy.
  • Above-ground biomass (AGB) Per hectare, per stand.
  • Tree crown volume Structural metrics by individual.
  • Terrain roughness index Slope and surface complexity.
  • Digital terrain & surface models DTM and DSM at native LiDAR resolution.
  • Slope / topography analysis Gradient and aspect mapping.
Indicators

Key applications

01

Vegetation height mapping

Continuous CHM across territory.
02

3D species modelling

Per-tree structure & ID.

03

Forest structure analysis

Canopy layers and gaps.

04

DTM / DSM generation

Production-ready terrain.

05

Biomass & carbon stock

AGB estimation at scale.

06

Urban tree inventory

City-scale 3D tree register.

07

Slope / topography

Engineering-grade terrain.

08

Crown volume

Individual-tree metrics.

What we deliver

From raw point cloud to decision

01

Classified point cloud

Ground, vegetation, structures separated.

02

Surface models

DSM, DTM, CHM at native resolution.

03

Derived products

AGB, slope, roughness, fraction cover.

04

Decision-ready indicators

Per-stand or per-territory KPIs and trends.

Applications

Who relies on LiDAR

Forestry · biomass, stock, harvesting Infrastructure · corridor and slope analysis Urban planning · 3D city models Carbon projects · biomass MRV Risk management · landslides, slopes
Why CASSIA

A traditional survey takes weeks.
A satellite pass takes a morning.

01

Continuous monitoring

No field teams required. Satellites pass overhead every few days.

02

Full spatial coverage

Wall-to-wall, repeatable, standardized not a sample of plots.

03

Drastic cost reduction

A fraction of what traditional surveys cost and far more often.

04

AI-powered indicators

Decision-ready metrics not raw rasters you have to interpret.

05

Weeks → hours

From data acquisition to actionable map, in a single working day.

Start here

Add the vertical
dimension.

Have a LiDAR dataset, or need one acquired? We will turn it into classified outputs, surface models and decision-ready indicators.

Discuss a LiDAR project →